


It's on-demand insight into patient engagement: Pageviews, Sessions, Top Brands & more
Want to know how your Gallery is doing? Now there's a fast and easy way to get a snapshot of it's usage. Compare month to month and track your progress!
Going forward, rather than a monthly report by email, My Frame Gallery users can access reports online whenever they want.
Simply login and navigate to the Metrics Dashboard! Here are the details:
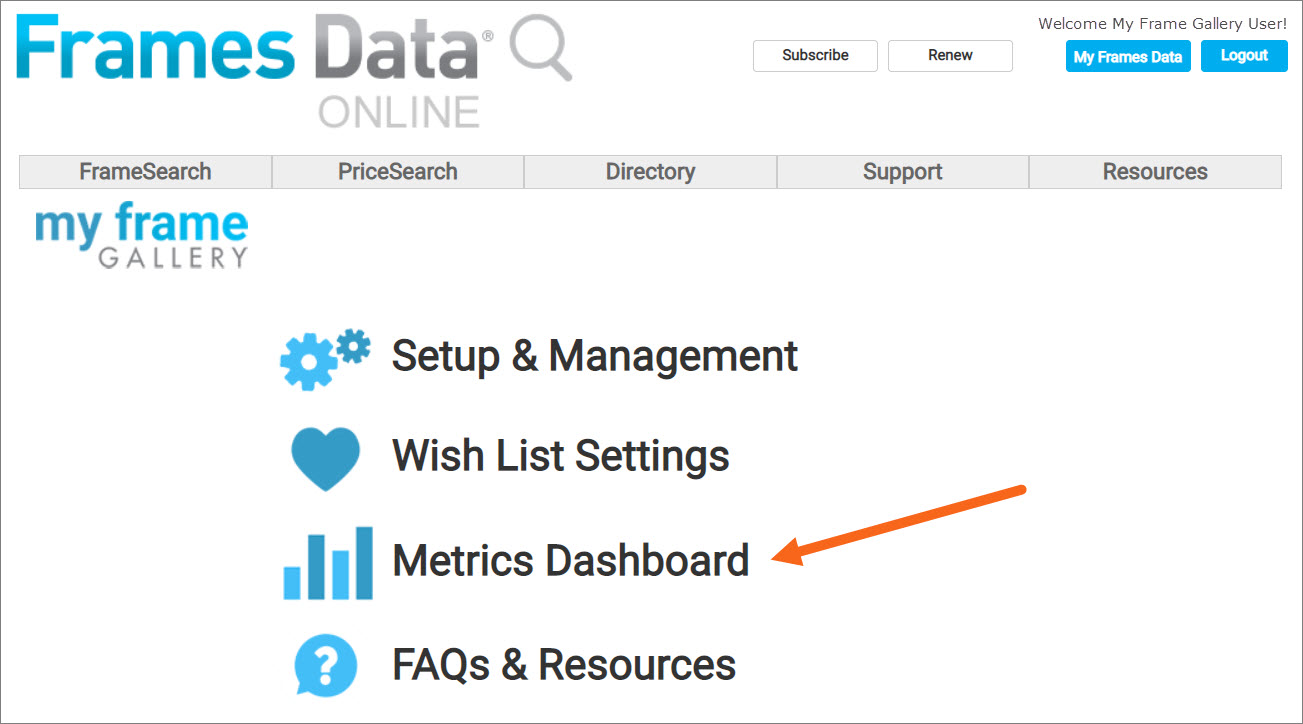
To view your Gallery's stats, log into your My Frame Gallery account on www.framesdata.com. Go to My Frames Data > My Frame Gallery to be taken to your MFG Main Menu. From here, click Metrics Dashboard.
From there, you will find the following categories of statistics:
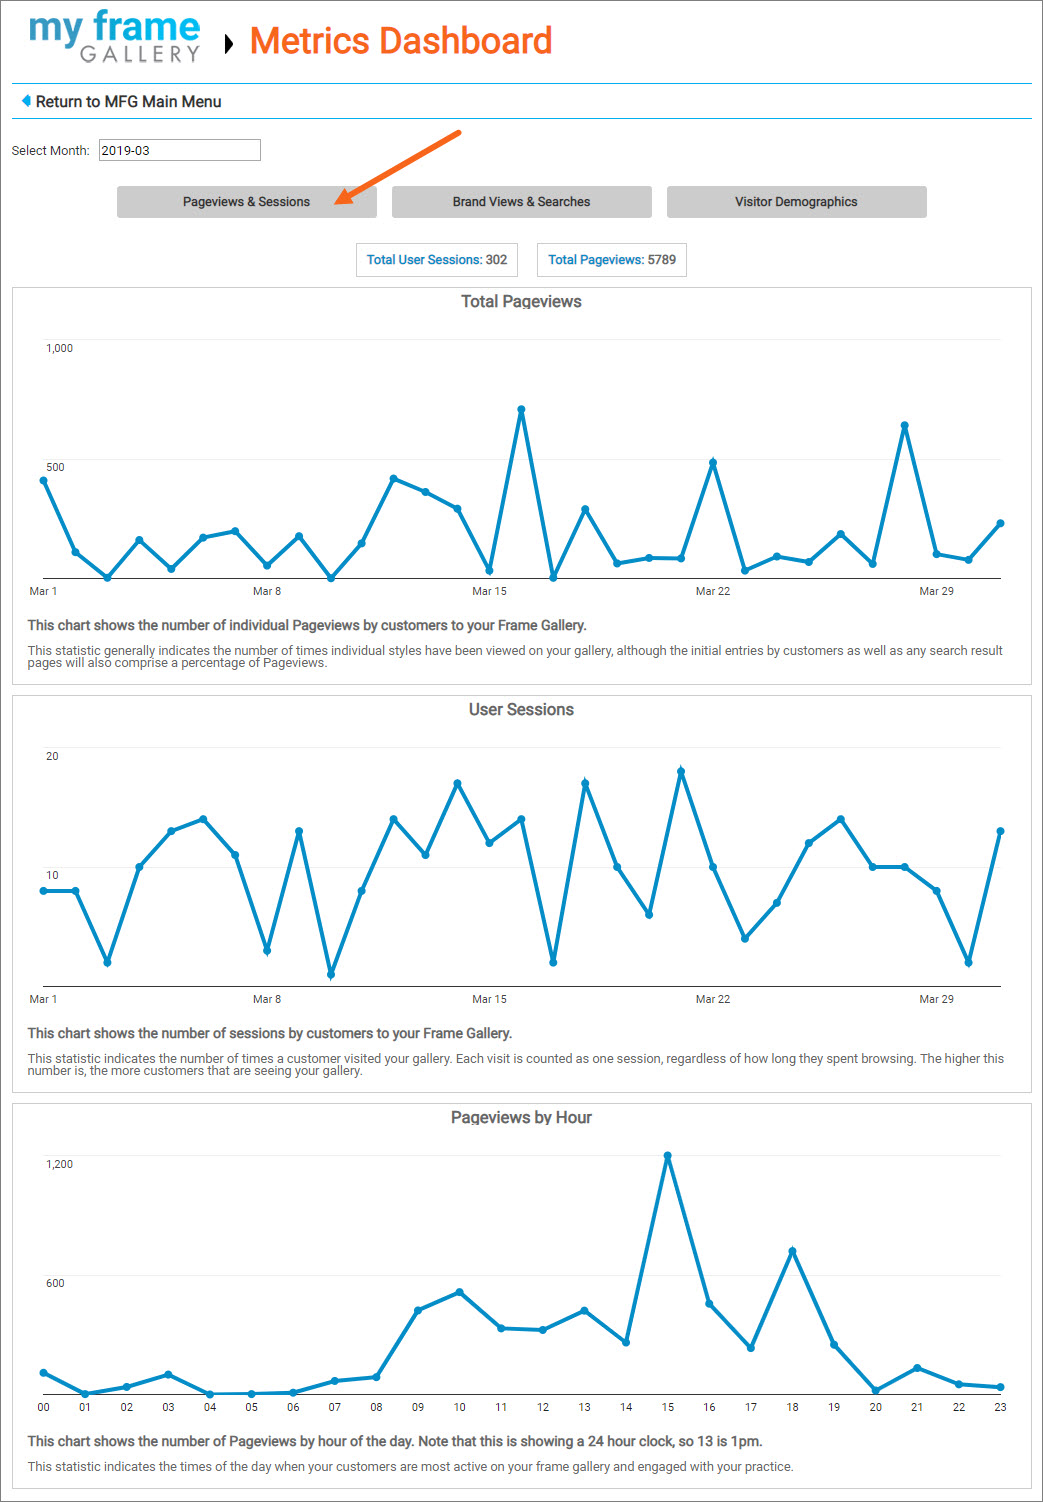
Pageviews & Sessions
You will automatically be taken to the Pageviews & Sessions page. This data can be viewed a month at a time, broken out by day (see examples below).
First you will see a chart of Total Pageviews, which counts all pageviews, including initial entries to the main Gallery page, search result views, individual styles viewed, multiple color ways viewed, and virtual try-on plugin uses.
Below that you'll find User Sessions, the number of times patients have visited your gallery (no matter how long they were there or how many pages they viewed).
Additionally, Pageviews by Hour tells you exactly when your gallery receives the most traffic throughout the day.
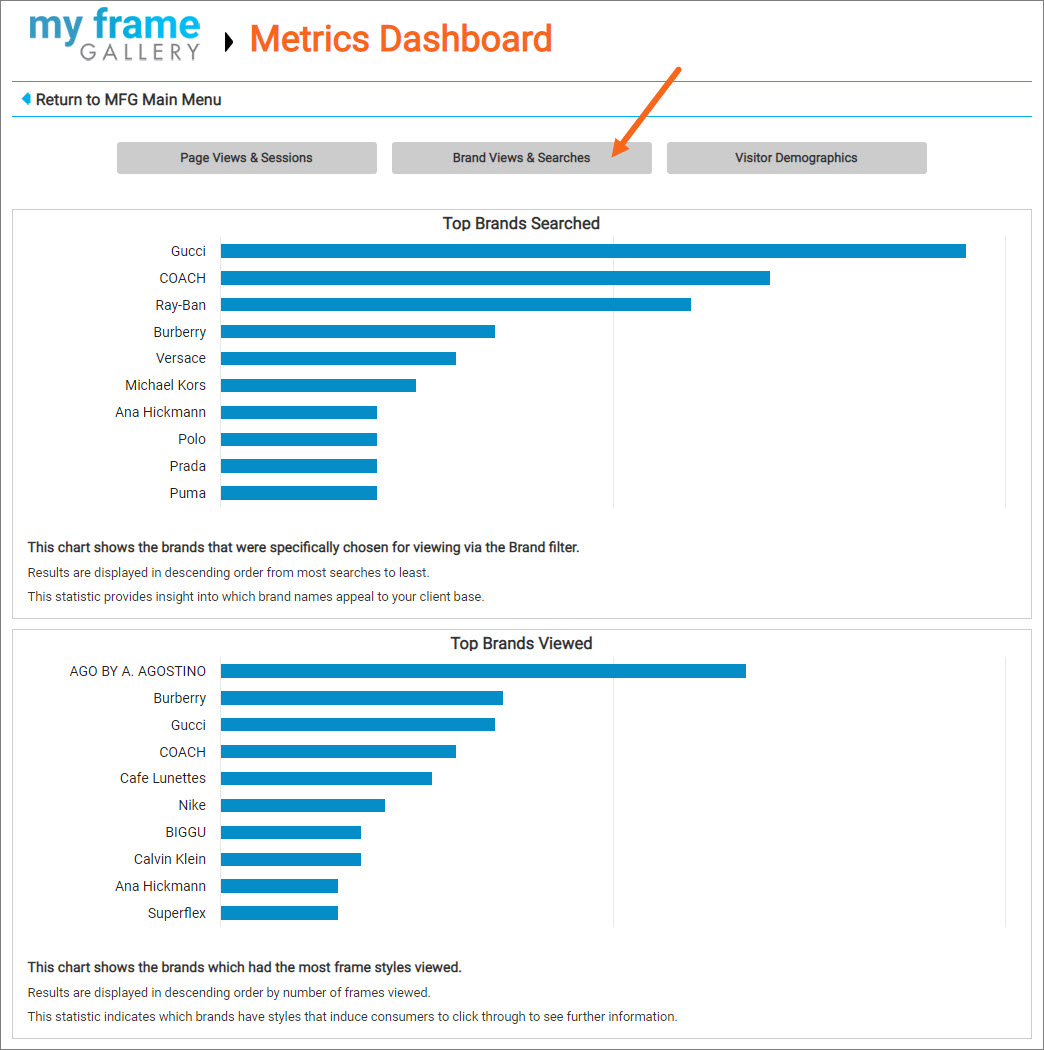
Brand Views & Searches
Which brands generate the most interest from your patients? Click the Brand Views & Searches tab to see your practice's most popular lines.
Top Brands Searched shows you the brands on your gallery that your patients have searched for the most (using the Brand filter).
Top Brands Viewed displays which brands had the largest overall number of frames viewed, whether they searched specifically for that brand or not.
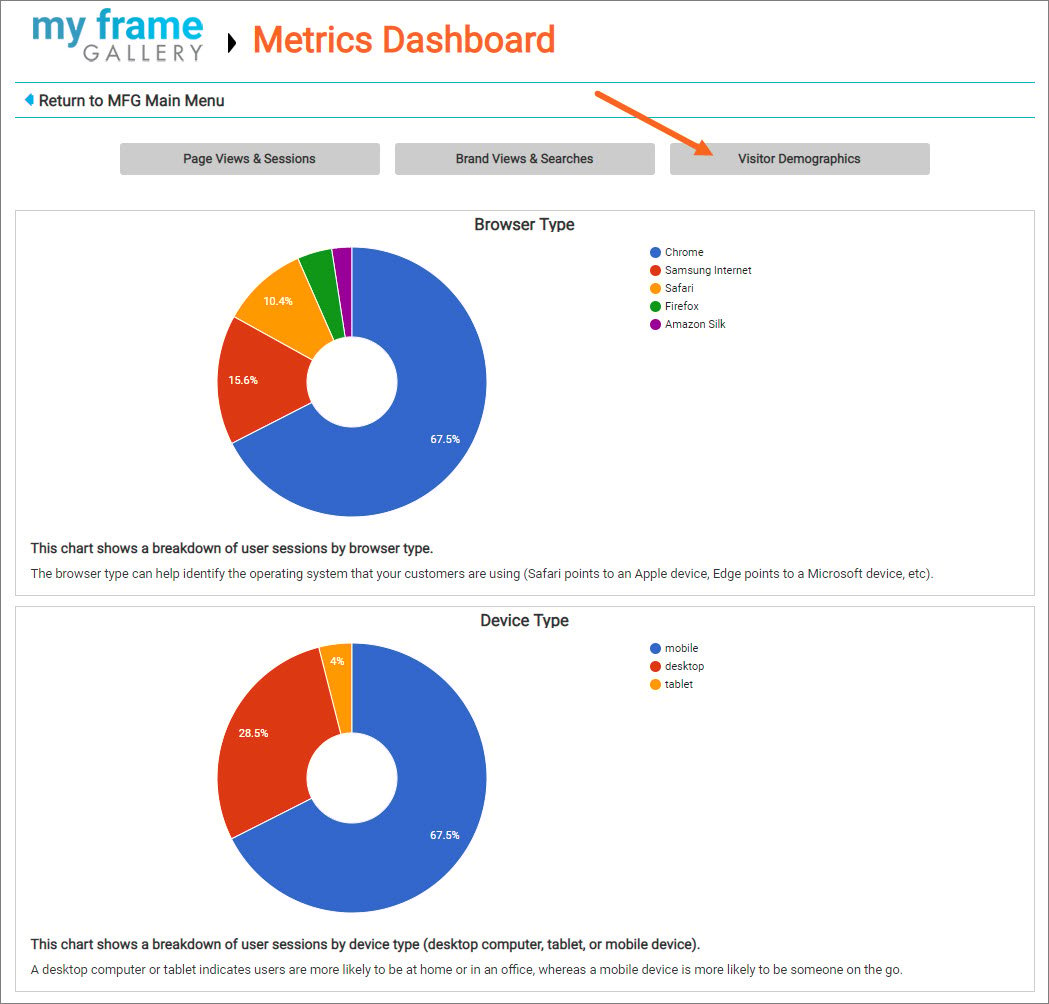
Visitor Demographics
Next, click Visitor Demographics. This page will give you insight into how patients are viewing your gallery.
Browser Type tells you the Internet browser they are using, which can help you identify which kind operating system they have.
Device Type indicates whether they are viewing your gallery on mobile, desktop, or tablet. If you realize that most of your patients use Safari on an iPhone, for example, take extra care that your website looks great on that device!
Check your dashboard regularly to stay on top of how your gallery is doing!

![Why should your practice have an online Gallery? [VIDEO]](https://blog.framesdata.com/hubfs/2024-01-09_15-14-02.png)


Leave a comment